
Yesterday, the U.S. Bureau of Labor Statistics released the results of the American Time Use Survey (ATUS). These data include the average amount of time per day in 2018 that individuals worked, did household activities, and engaged in leisure and sports activities. Additionally, measures of the average time per day spent providing childcare—both as a primary (or main) activity and while doing other things—for the combined years 2014-18 were provided.
I was most curious about how Americans spend their leisure time, and to see how it compares with how I spend mine. Here are some of the results focused just on leisure time:
- On an average day, nearly everyone age 15 and over (96 percent) engaged in some sort of leisure activity, such as watching TV, socializing, or exercising. Men spent 5.7 hours per day on such activities, compared with 4.9 hours for women.
- On average, adults age 75 and over spent 7.8 hours engaged in leisure activities per day—more than any other age group; 25- to 44-year-olds spent a little over 4.0 hours engaged in leisure and sports activities per day—less than other age groups.
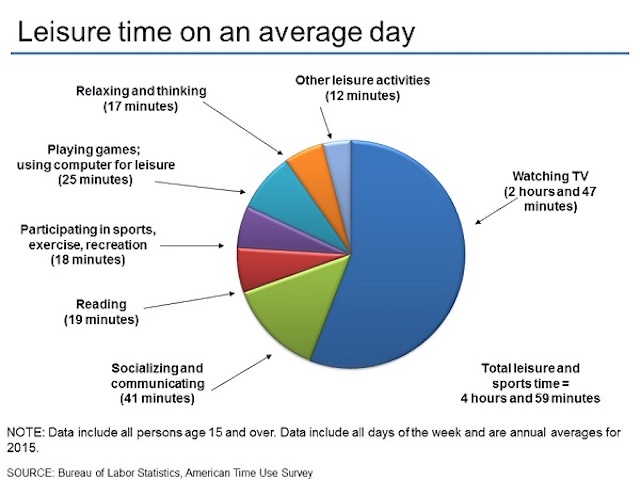
- Watching TV was the leisure activity that occupied the most time (2.8 hours per day), accounting for just over half of all leisure time, on average.
- Socializing and communicating, such as visiting with friends or attending or hosting social events, accounted for an average of 38 minutes per day, and was the next most common leisure activity after watching TV. Individuals spent about twice as much time socializing on weekend days (59 minutes) as on weekdays (29 minutes).
- Time spent reading for personal interest varied greatly by age. Individuals age 75 and over averaged 48 minutes of reading per day whereas individuals ages 15 to 54 read on average for 10 minutes or less per day.
- On average, persons ages 15 to 24 spent the most time playing games or using a computer for leisure—about one hour per day.
- Men were more likely than women to participate in sports, exercise, or recreation on any given day—21 percent, compared with 17 percent. On days that they participated, men also spent more time engaged in sports, exercise, or recreation than did women—1.7 hours per day, compared with 1.3 hours.
As I look over this data, a few things jump out at me.
First, I think I’m really going to enjoy retirement. 7.8 hours per day engaged in leisure activities? That sounds quite appealing. And not to mention all that time reading…
Second, I may not be as anti-social as I thought. Even if I don’t socialize with anyone over the course of a weekday, that’s only 29 minutes per day that I’m being anti-social. And I know exactly where to use that 29 minutes (see next bullet point)
Third, I’m shocked by how little time people in the 15-54 age range spend reading – just 10 minutes per day! Perhaps if people in this age group cut down on their socializing and on playing video games, they might find some time to read!
So there you have it – a snapshot of how Americans spend their leisure time.
How do you compare?
*chart from Bureau of Labor Statistics

I’m looking to draft a blog post for my site that uses a similar data set. It’s crazy how much time the average American spends doing things that are what I would consider to be passive leisure activities.
Over the course of a year, if we watch television for 2.8 hours a day, that’s 1022 hours, or 42.5 days! Nearly a month and a half worth of time dedicated to watching television. Over the course of the average adult life of 60 years (78 – 18), this amounts to 7 years!
Think of how much time we could buy ourselves if we simply change our television habits. Thanks for the write up, Jim.
LikeLiked by 1 person
I agree, Zach. TV can be a great time waster. That being said, it can also be a nice source of entertainment when used wisely!
LikeLike