

The Organisation for Economic Co-operation and Development (OECD ) Programme for International Student Assessment (PISA) examines what 15-year old students know in reading, mathematics, and science, and what they can do with what they know. It provides the most comprehensive and rigorous international assessment of student learning outcomes to date. Results from PISA indicate the quality and equity of learning outcomes attained around the world, and allow educators and policymakers to learn from the policies and practices applied in other countries.
Some 600,000 students completed the assessment in 2018, representing about 32 million 15-year olds in the schools of the 79 participating countries and economies. In the United States, 4 838 students, in 215 schools, completed the assessment, representing 3,559,045 15-year-old students
Since I live in the United States, my focus will be on how well we did on the tests. Here were some key findings from the report (you can see the actual rankings at the end of this post):
- Students in the United States performed above the OECD average in reading (505 score points) and science (502), and below the OECD average in mathematics (478). The trend lines of United States’ mean performance in reading since 2000, mathematics since 2003 and science since 2006 are stable, with no significant improvement or decline. Nevertheless, in reading, the share of 15-year-old students who scored at Level 5 or 6 (top performers) increased by almost 4 percentage points – a statistically significant increase – between 2009 and 2018, to 13.5%.
- As in many countries, socio-economically advantaged students in the United States outperformed disadvantaged students in reading, mathematics, and science. In reading, the performance gap between socio-economically advantaged and disadvantaged students was 99 score points (OECD average: 89 score points). Some 27% of advantaged students in the United States, but only 4% of disadvantaged students (OECD averages: 17% and 3%, respectively), were top performers in reading, meaning that they attained one of the two highest proficiency levels. However, 10% of disadvantaged students in the United States were able to score amongst the top quarter of students in their country in reading.
- The gender gap in reading in favour of girls was 24 score points in the United States (OECD average: 30 score points). In the United States, boys outperformed girls in mathematics (by 9 score points), while in science boys and girls performed similarly. Amongst high-performing students in mathematics or science, about three in ten boys in the United States expect to work as an engineer or science professional at the age of 30, while only one in ten girls expects to do so.
- In the United States, the proportion of students with an immigrant background was 19% in 2009 and 23% in 2018 (the change between 2009 and 2018 was not statistically significant). Amongst these immigrant students, about two in five were socio-economically disadvantaged. While immigrants and non-immigrants scored at a similar level before accounting for students’ and schools’ socio-economic profile, immigrant students outperformed their native-born peers by 16 score points after accounting for these factors. Immigrant students were also more than 25% less likely than non-immigrant students to be low performers after taking into account students’ and schools’ socio-economic profile, and gender.
- Sizeable proportions of students who performed poorly in the United States still held ambitious expectations about their future education. More than three in four low-performing students reported that they expect to complete tertiary education (compared to 48% on average across OECD countries).
If you’d like to take a look at the questions to see how you think you would fare compared to a 15-year old, here is the link.
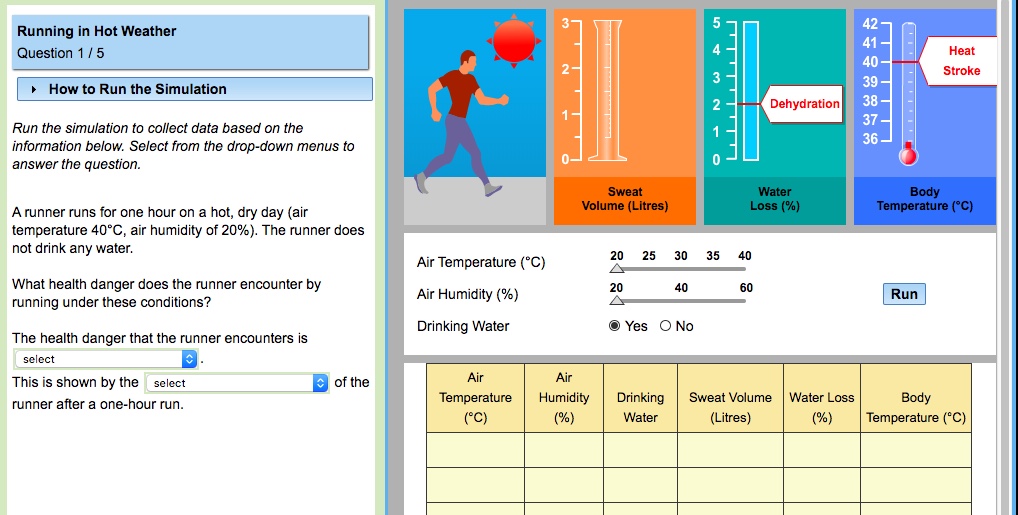
Here’s a sample question from each category. You can click on the image to go to the actual question if you would like to interact with the questions.
Reading Fluency:

Math

Science
The OECD is trying to change the test to be about more than academics, in part to encourage countries to view education beyond traditional subjects. In the latest test, it assessed global competency, asking students to express how they relate to others and what they think of their lives and their future; in the next test, in 2021, it will assess creative thinking.
It also regularly asks students questions about their wellbeing, including measures of belonging and life satisfaction.
- When it comes to school climate, the United States was the only participating country where students with a stronger sense of belonging at school scored lower (by 4 score points) in reading than students with a weaker sense of belonging, after controlling for students’ and schools’ socio-economic profile. By contrast, the United States was amongst those countries and economies where students’ sense of belonging at school was most positively related to their expectations to complete a tertiary degree, which includes earning a bachelor’s, master’s or doctoral degree. In addition, students in the United States reported significantly more competition than co-operation amongst their schoolmates to a greater degree than students in any other PISA-participating country/economy.
- Holding a growth mindset is positively related to better academic performance in almost every education system. This is especially true for 15-year-old students in the United States. Students who disagreed or strongly disagreed with the statement “Your intelligence is something about you that you can’t change very much” scored 58 points higher in reading than students who agreed or strongly agreed with the statement, after accounting for students’ and schools’ socio-economic profile (OECD average: 32 score points higher).
- In the United States, 26% of students reported being bullied at least a few times a month, compared to 23% on average across OECD countries. At the same time, 93% of students in the United States (and 88% of students on average across OECD countries) agreed or strongly agreed that it is a good thing to help students who cannot defend themselves.
- In the United States, 61% of students (OECD average: 67%) reported that they are satisfied with their lives (i.e. students who reported between 7 and 10 on the 10-point life-satisfaction scale).
- Some 93% of students in the United States reported sometimes or always feeling happy and about 11% of students reported always feeling sad. In most countries and economies, students were more likely to report positive feelings when they reported a stronger sense of belonging at school and greater student co-operation, and were also more likely to express sadness when they were bullied more frequently.
- A majority of students across OECD countries hold a growth mindset (i.e. they disagreed or strongly disagreed with the statement “Your intelligence is something about you that you can’t change very much”). In the United States, 68% of students hold a growth mindset.
One chart I found interesting shows the top career choices for 15-year olds, by gender:
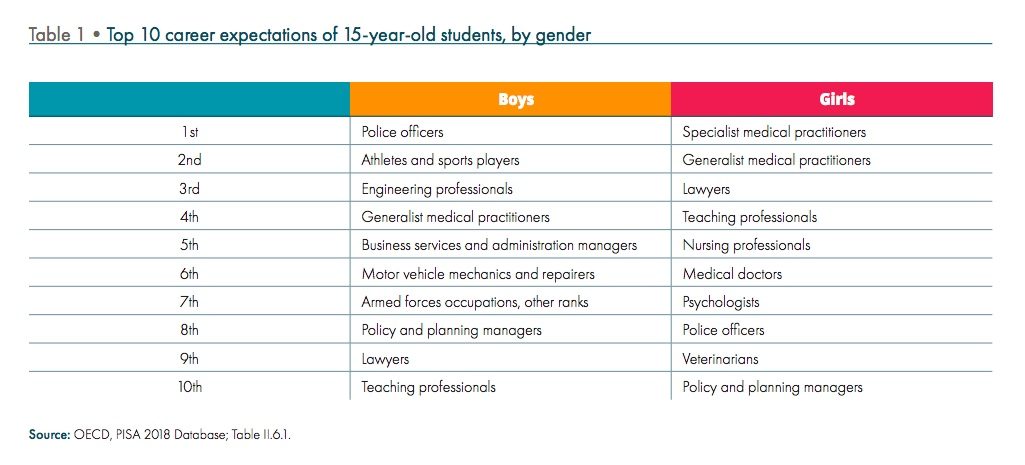 I would have never guessed that a career as a police officer would be rated so highly. I am happy to see that teachers are on both lists. It’s also interesting that a career in business is mentioned by boys, but not girls.
To me, the main takeaway from the study is that there is certainly room for improvement in the U.S. I think it would be worth an in-depth study of what the highest performing countries are doing, and then try to implement such methods in our classes.
Results of 2018 PISA Tests
Reading
The chart below shows the top-ranked countries in the world with respect to the reading portion of the PISA assessment:

Math
The chart below shows the top-ranked countries in the world with respect to the math portion of the PISA assessment:

Science
The chart below shows the top-ranked countries in the world with respect to the science portion of the PISA assessment:

*image from YouTube

The results are very interesting, Jim. I’m sure they have featured in your news reports over there as much as they have here.
LikeLike
I’ve seen a lot on the web about the results, not so much on TV…
LikeLike
Same. I read my news reports in emails. 🙂
LikeLike
I never knew this type of standard testing crossed borders in such a way. I have always been exposed to the tests and measures we use here in the U.S. to rate our educational success. Having the larger scope of other countries involved gives a more detailed picture. It seems like you teach me something new every day!
LikeLike
it is helpful to compare all the countries against each other so that hopefully we can learn from each other what works and what doesn’t.
LikeLike
Very interesting to see the topped ranked countries.
LikeLike